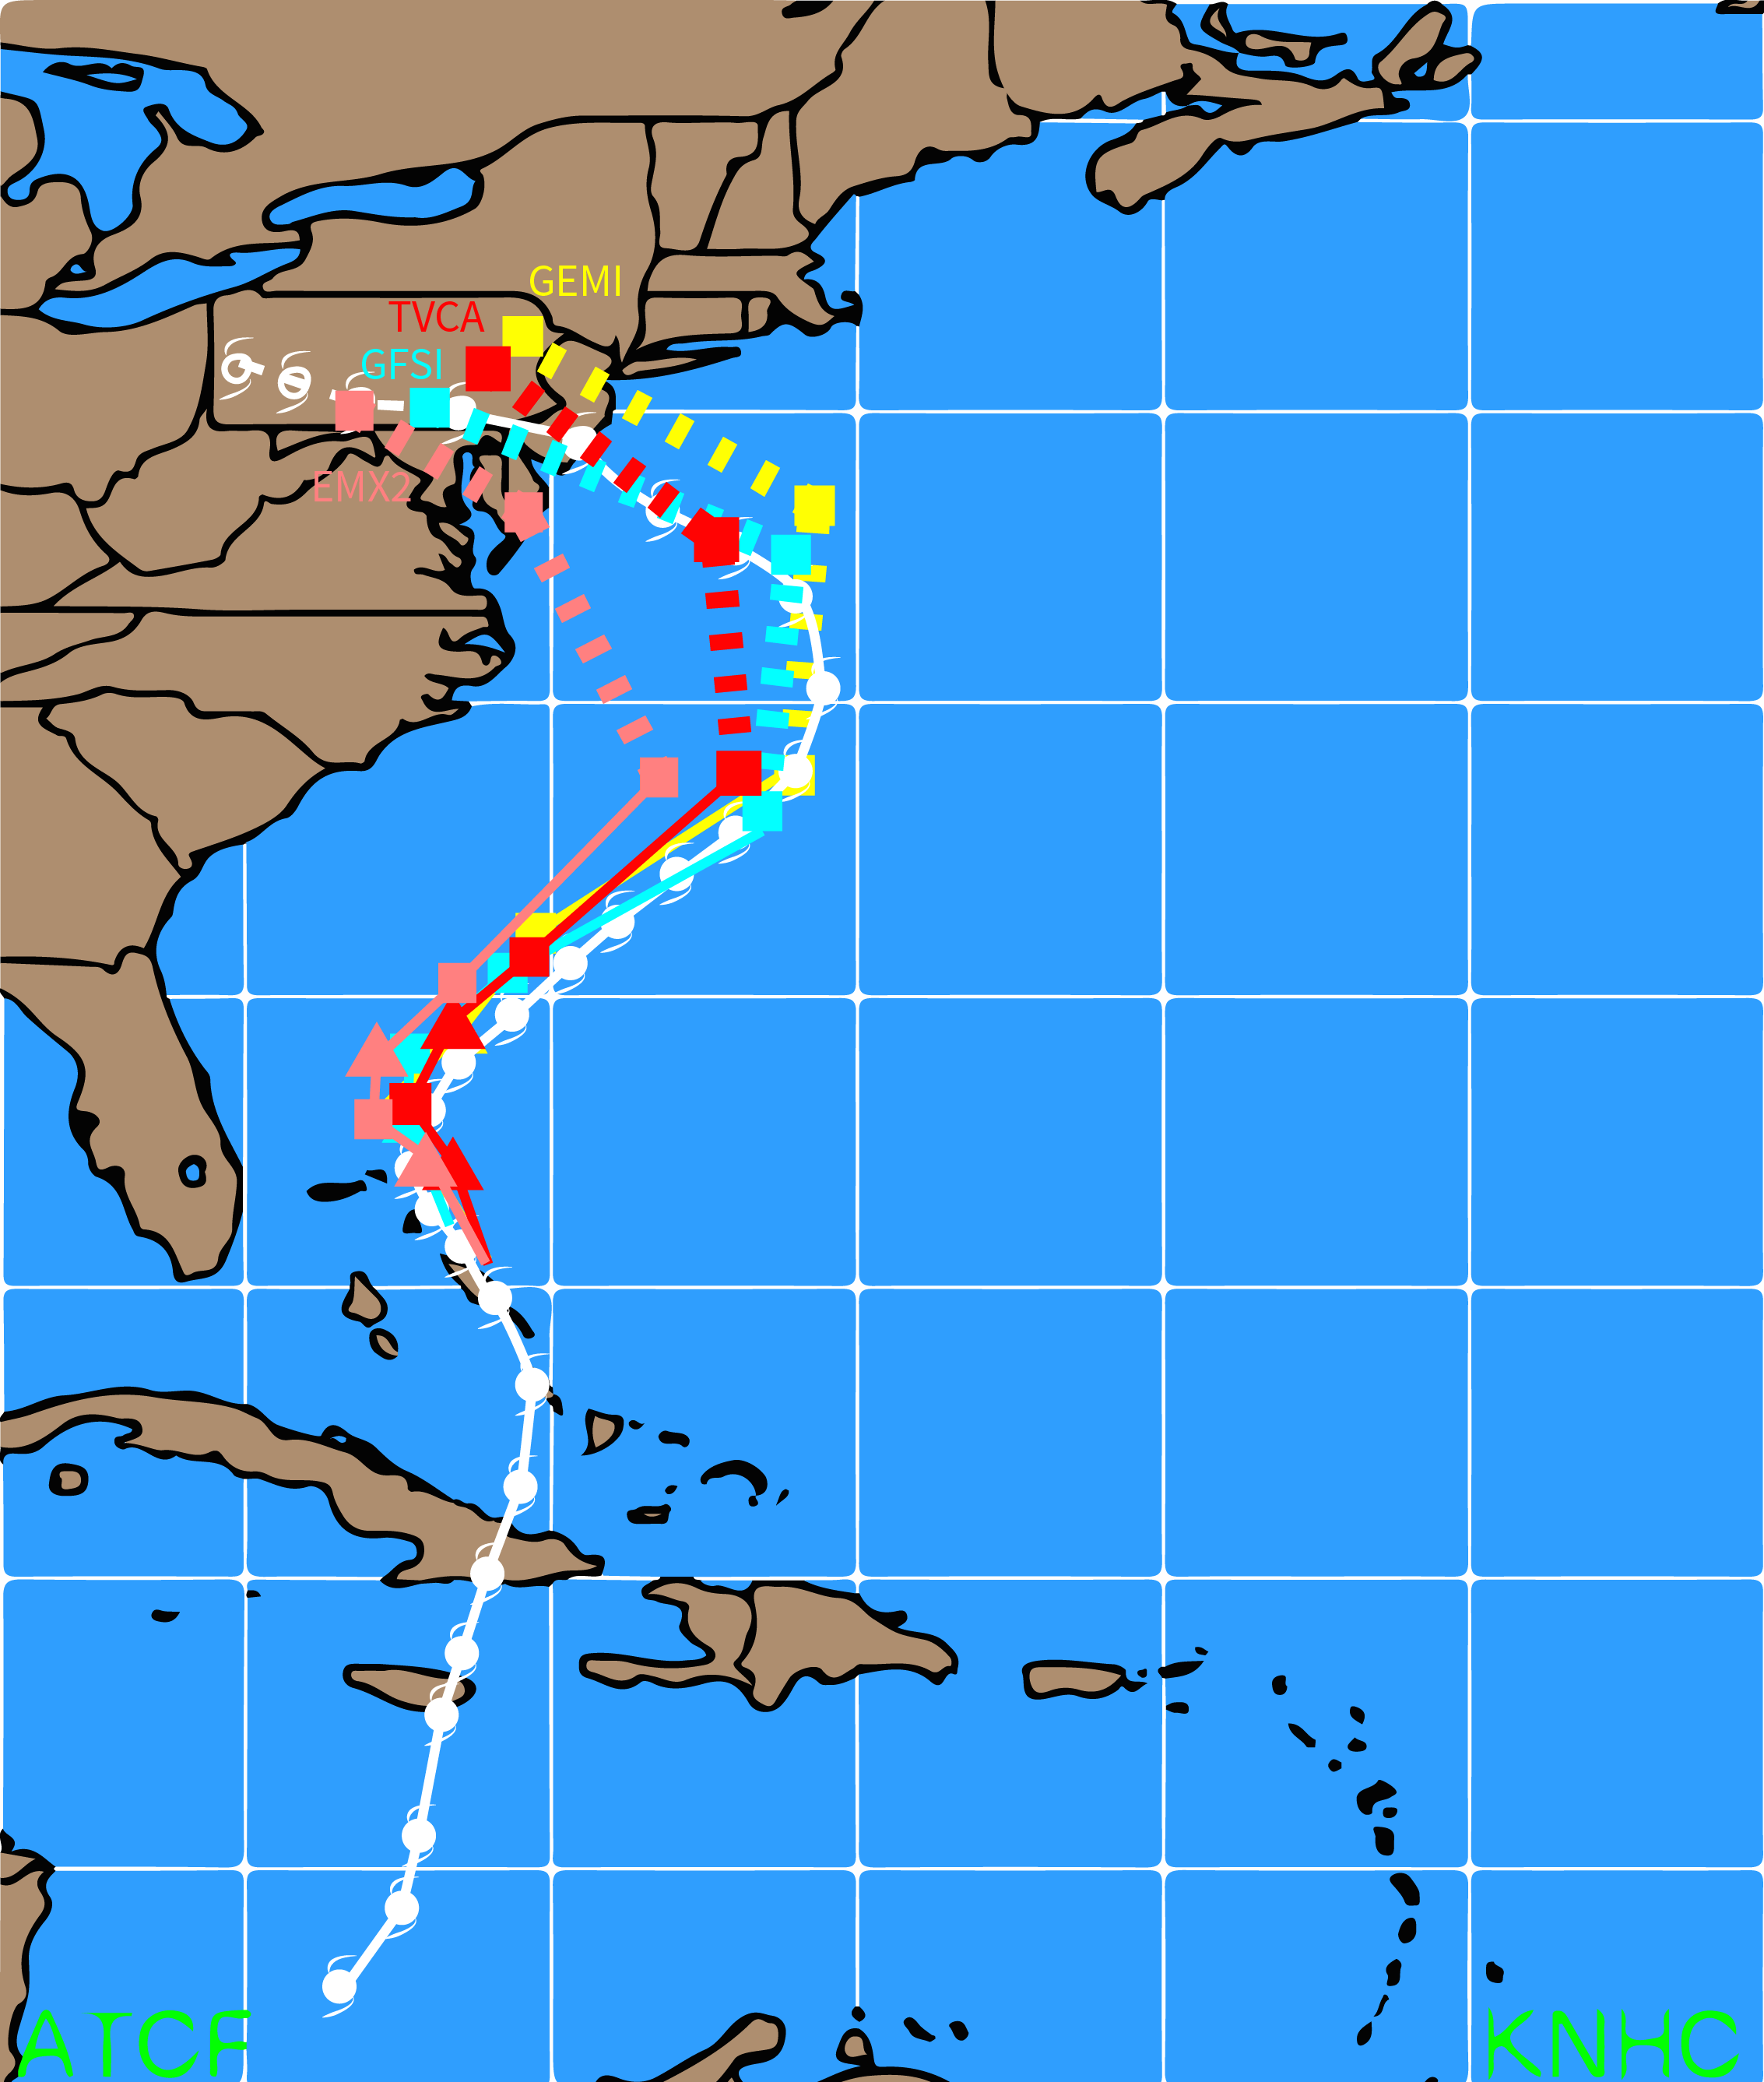
Model forecast tracks at 0000 UTC Tuesday 23 October 2012
Hurricane Sandy Impact on the Financial Market
The official hurricane track is represented by white, solid color lines for forecasts through 72 hours, while dashed lines represent forecasts through 72-120 hours. Dotted lines represent the 120-168 hour forecasts (top panels only). European Centre for Medium Range Weather Forecasts (ECMWF) are represented by coral lines. Track Variable Consensus Aids (TVCA) model consensus can be seen in red lines. Global Forecast System (GFS) are represented by cyan lines. Global Environmental Multiscale Model (GEMI) is represented by yellow lines.
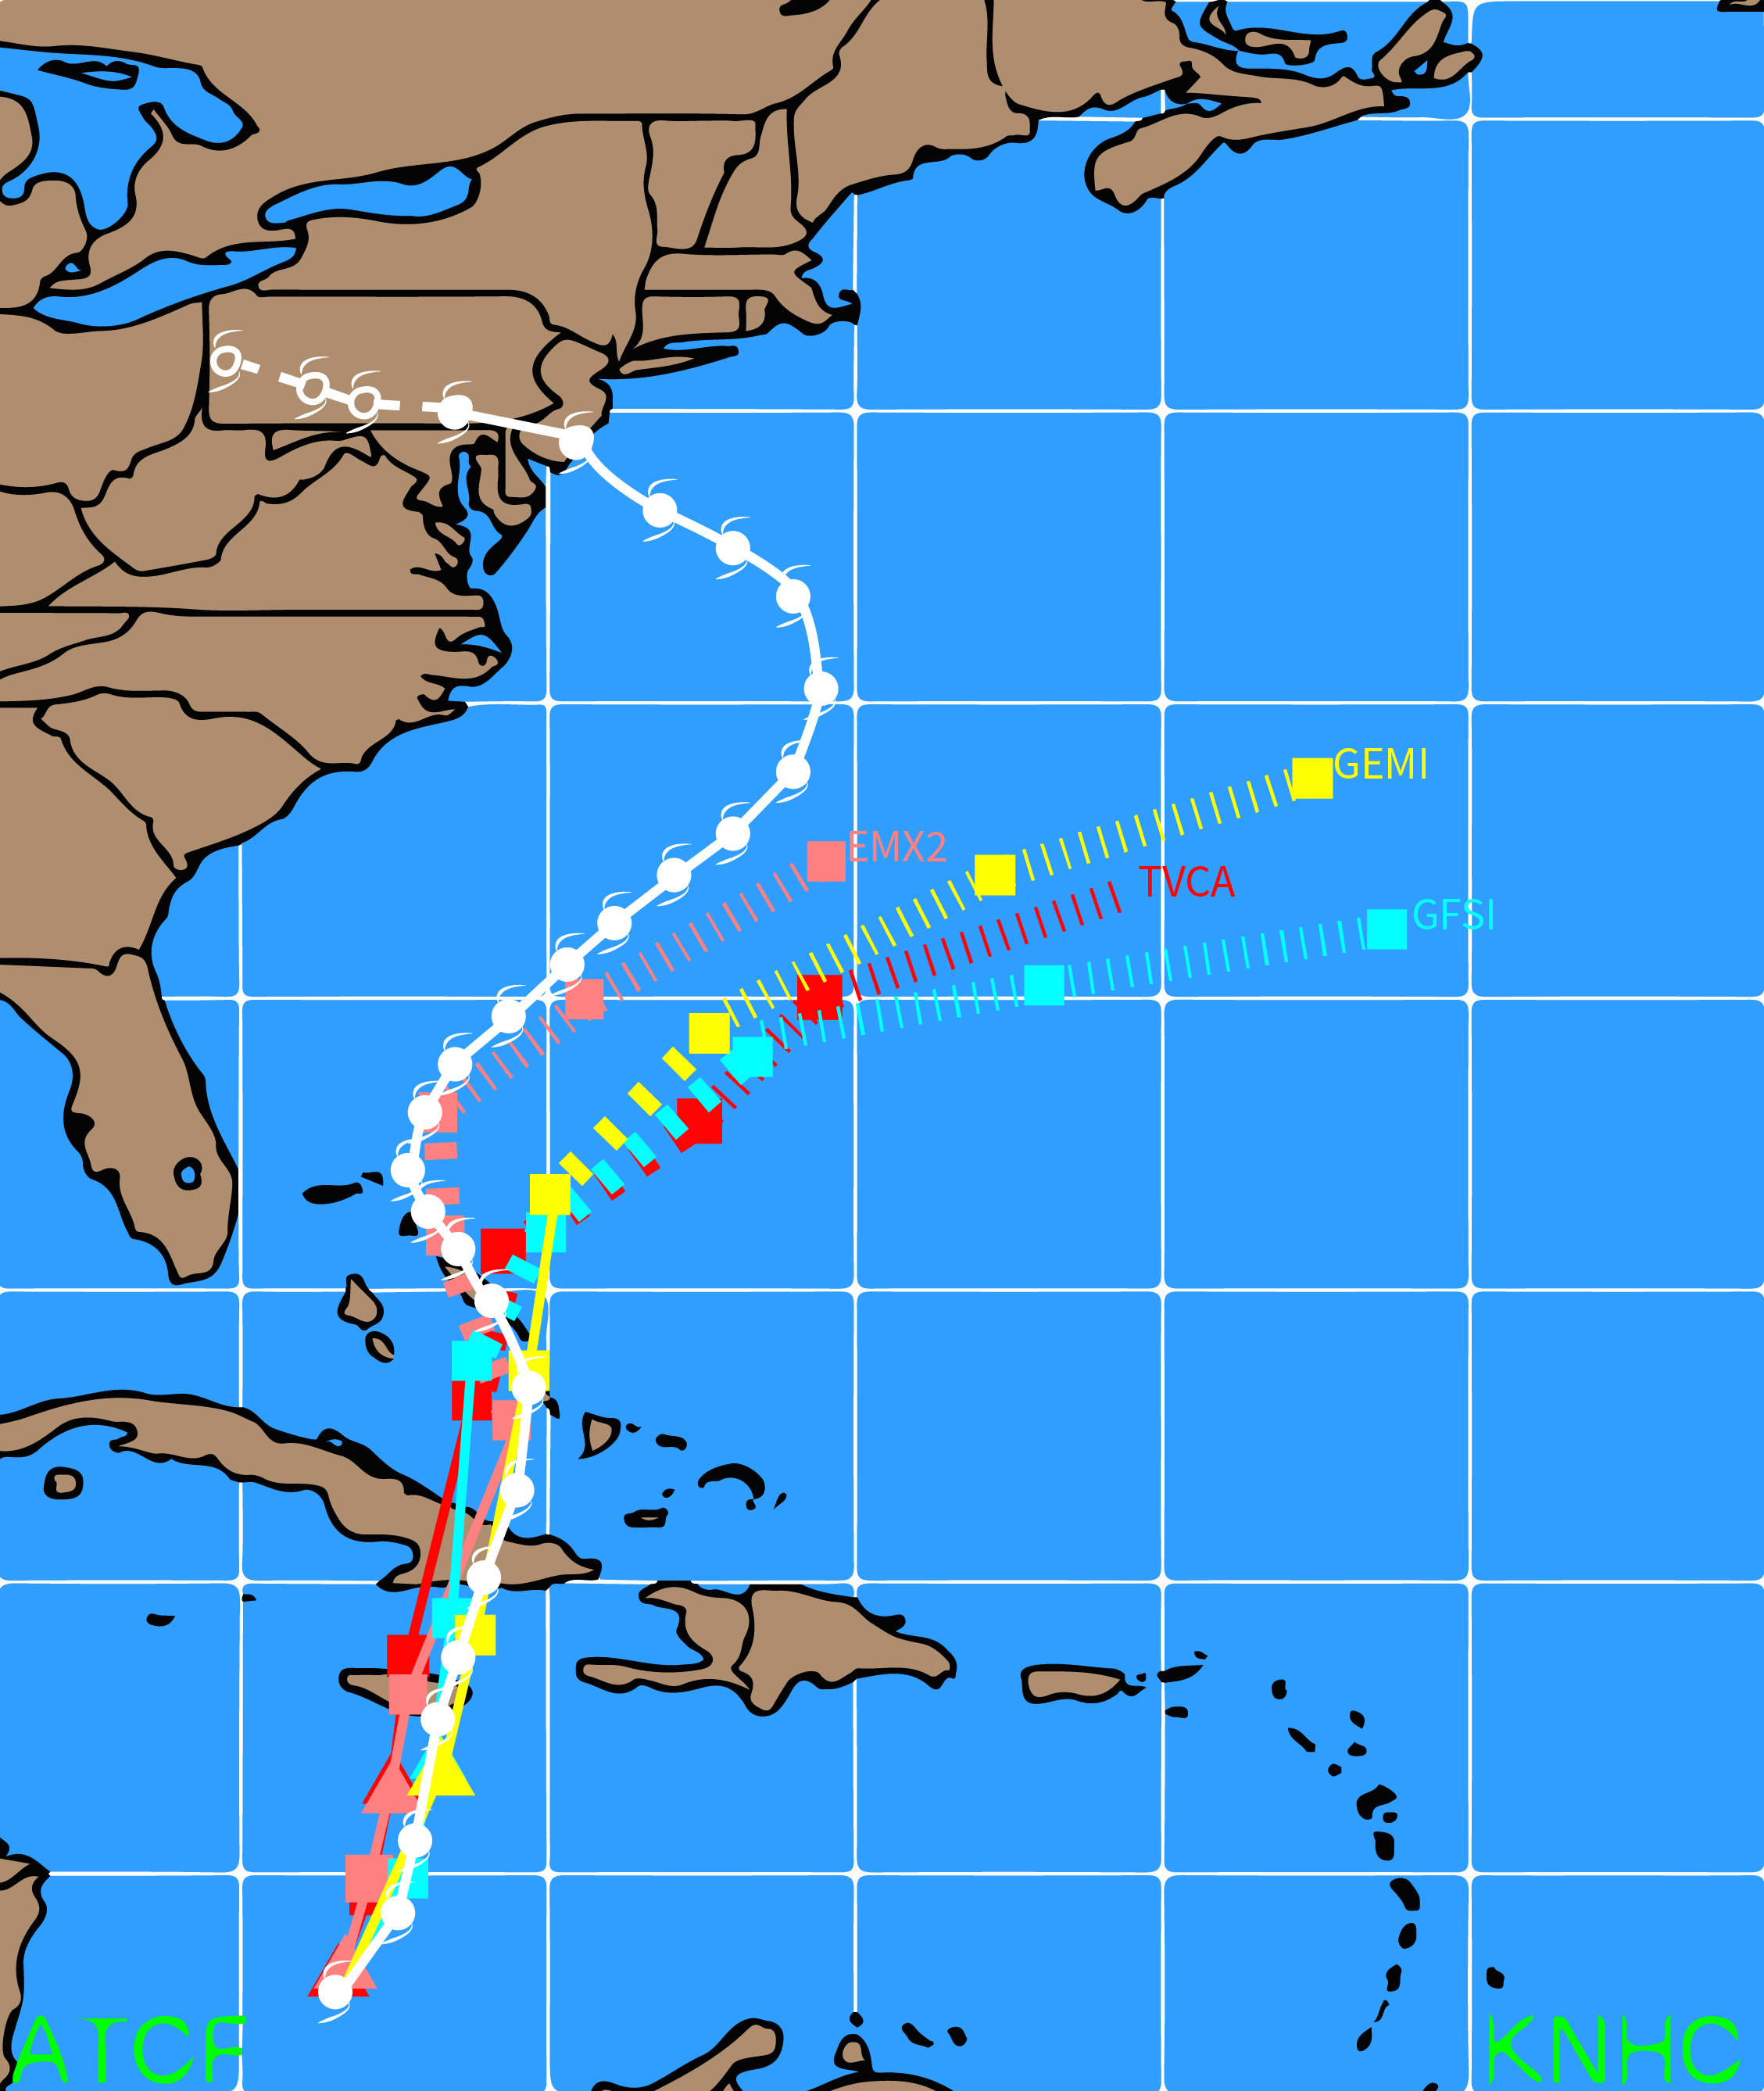
Model forecast tracks at 0000 UTC Wednesday 24 October 2012
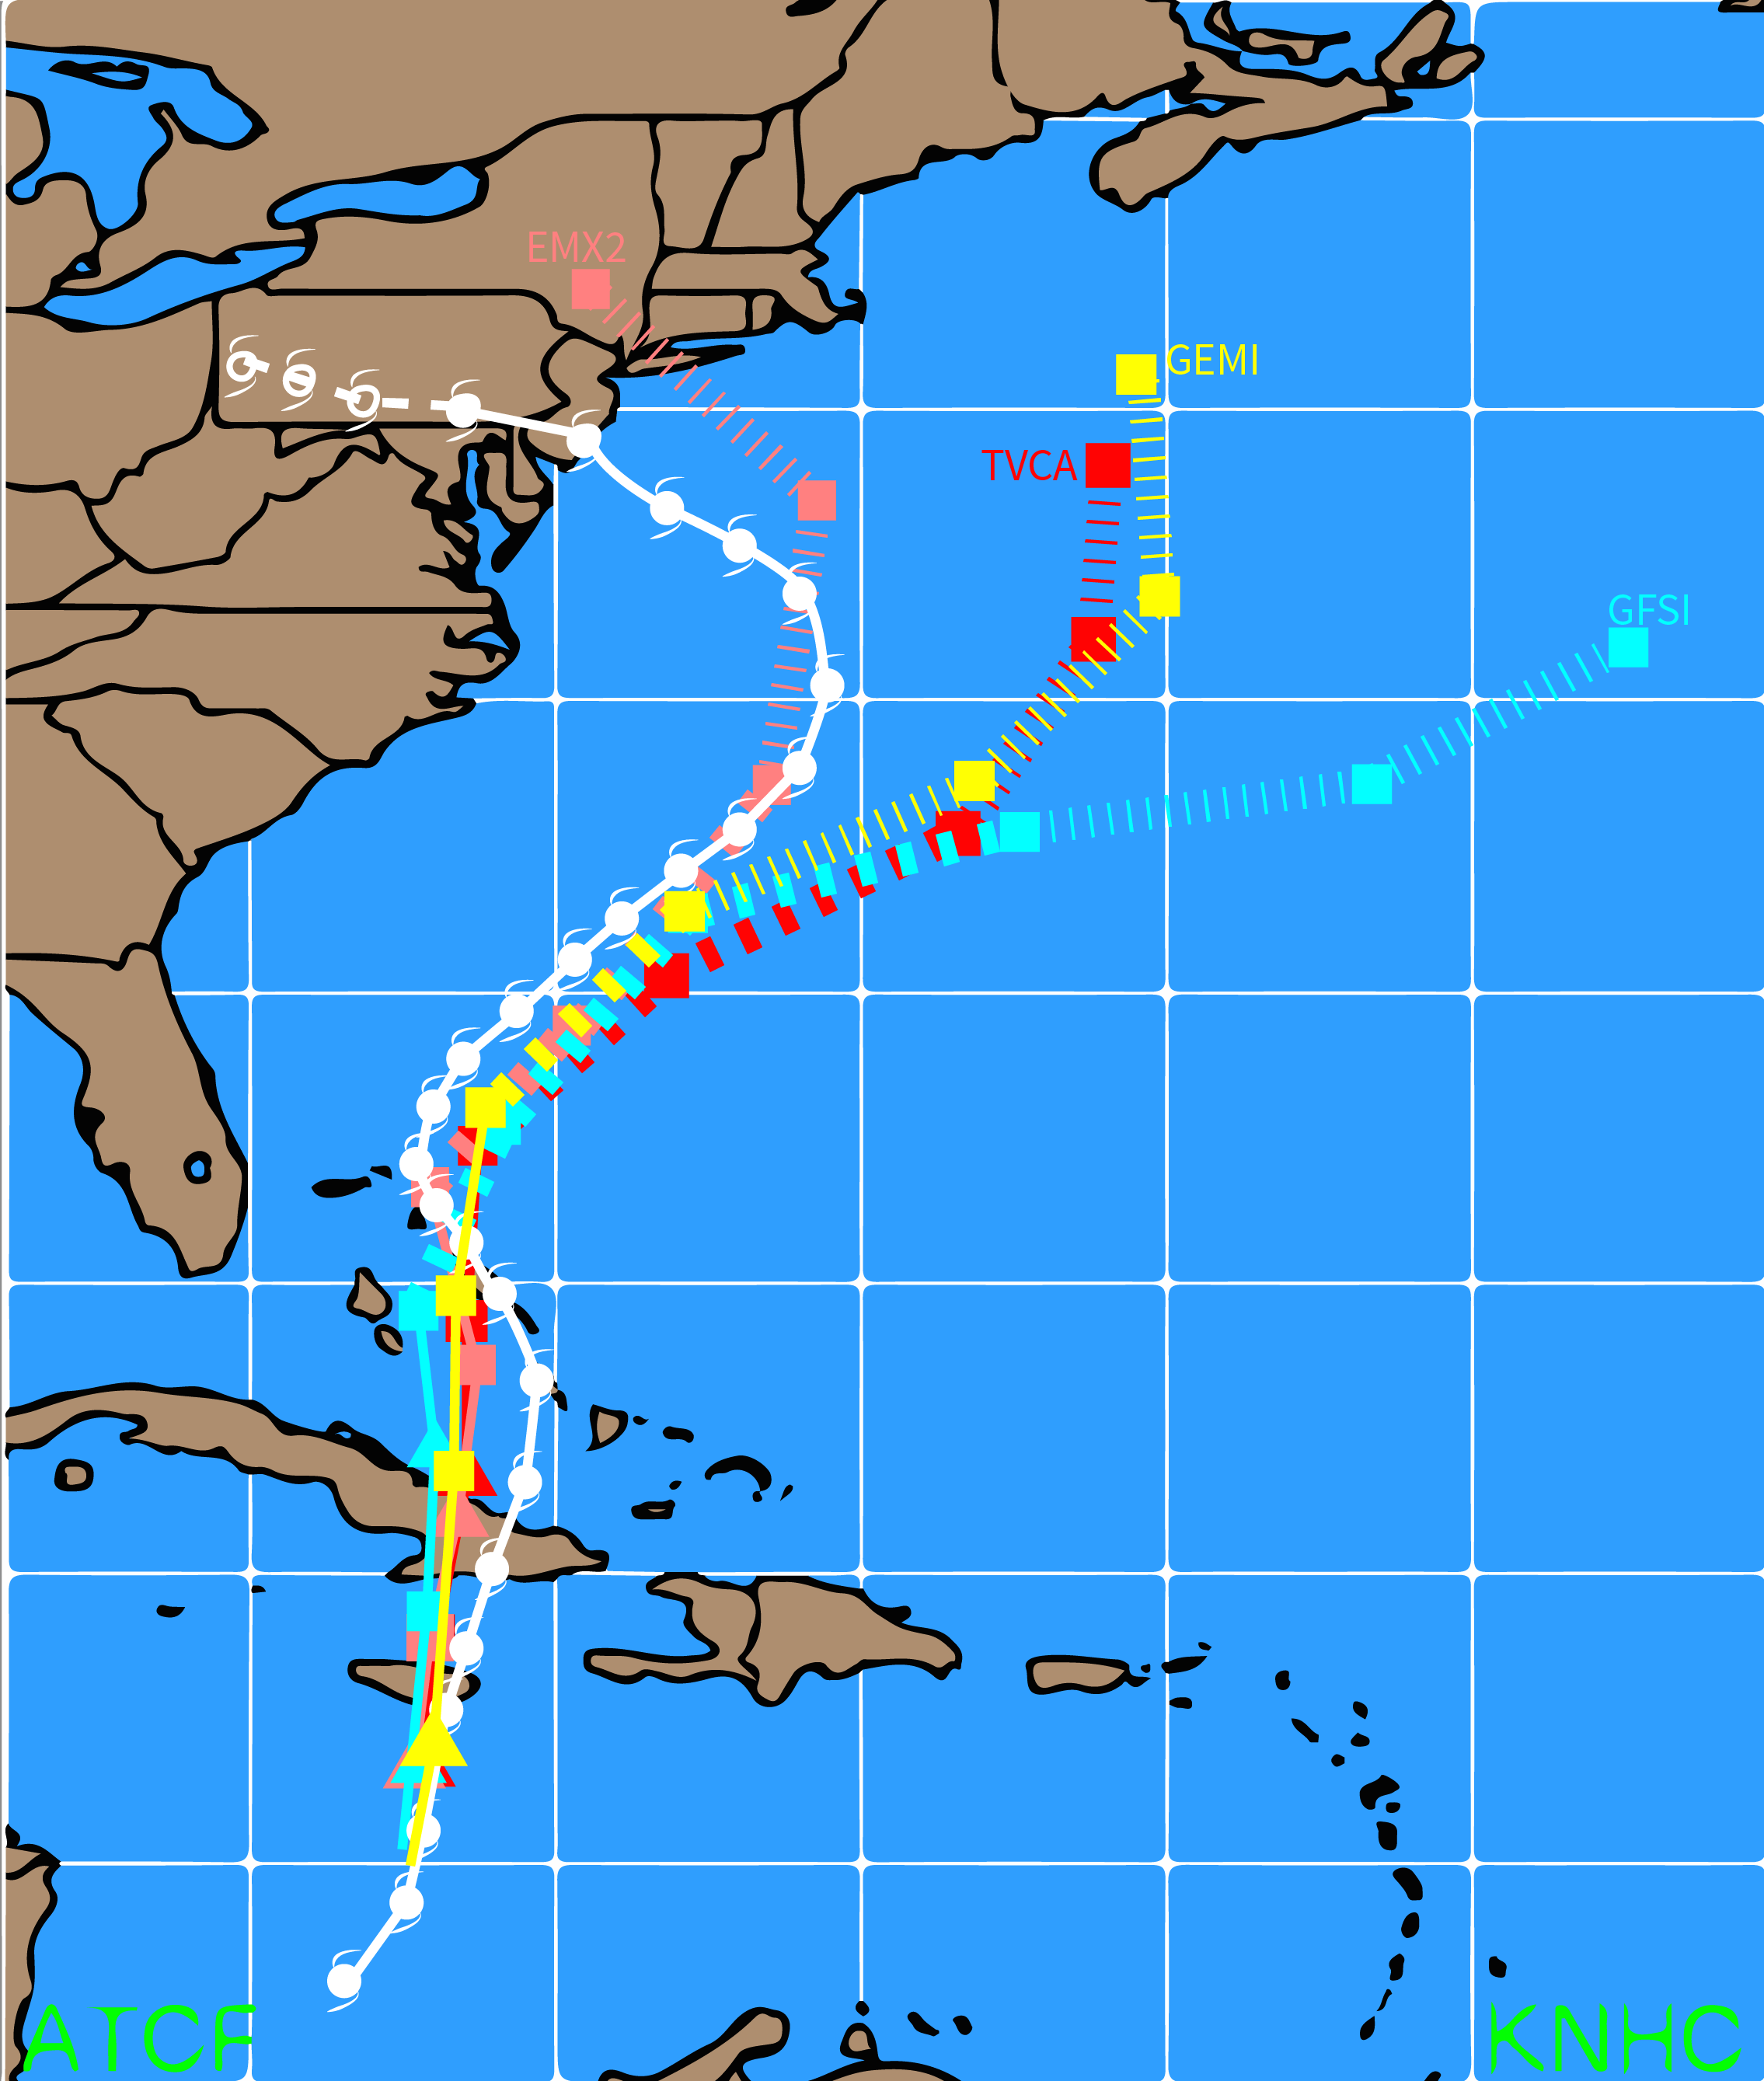
Model forecast tracks at 0000 UTC Thursday 25 October 2012
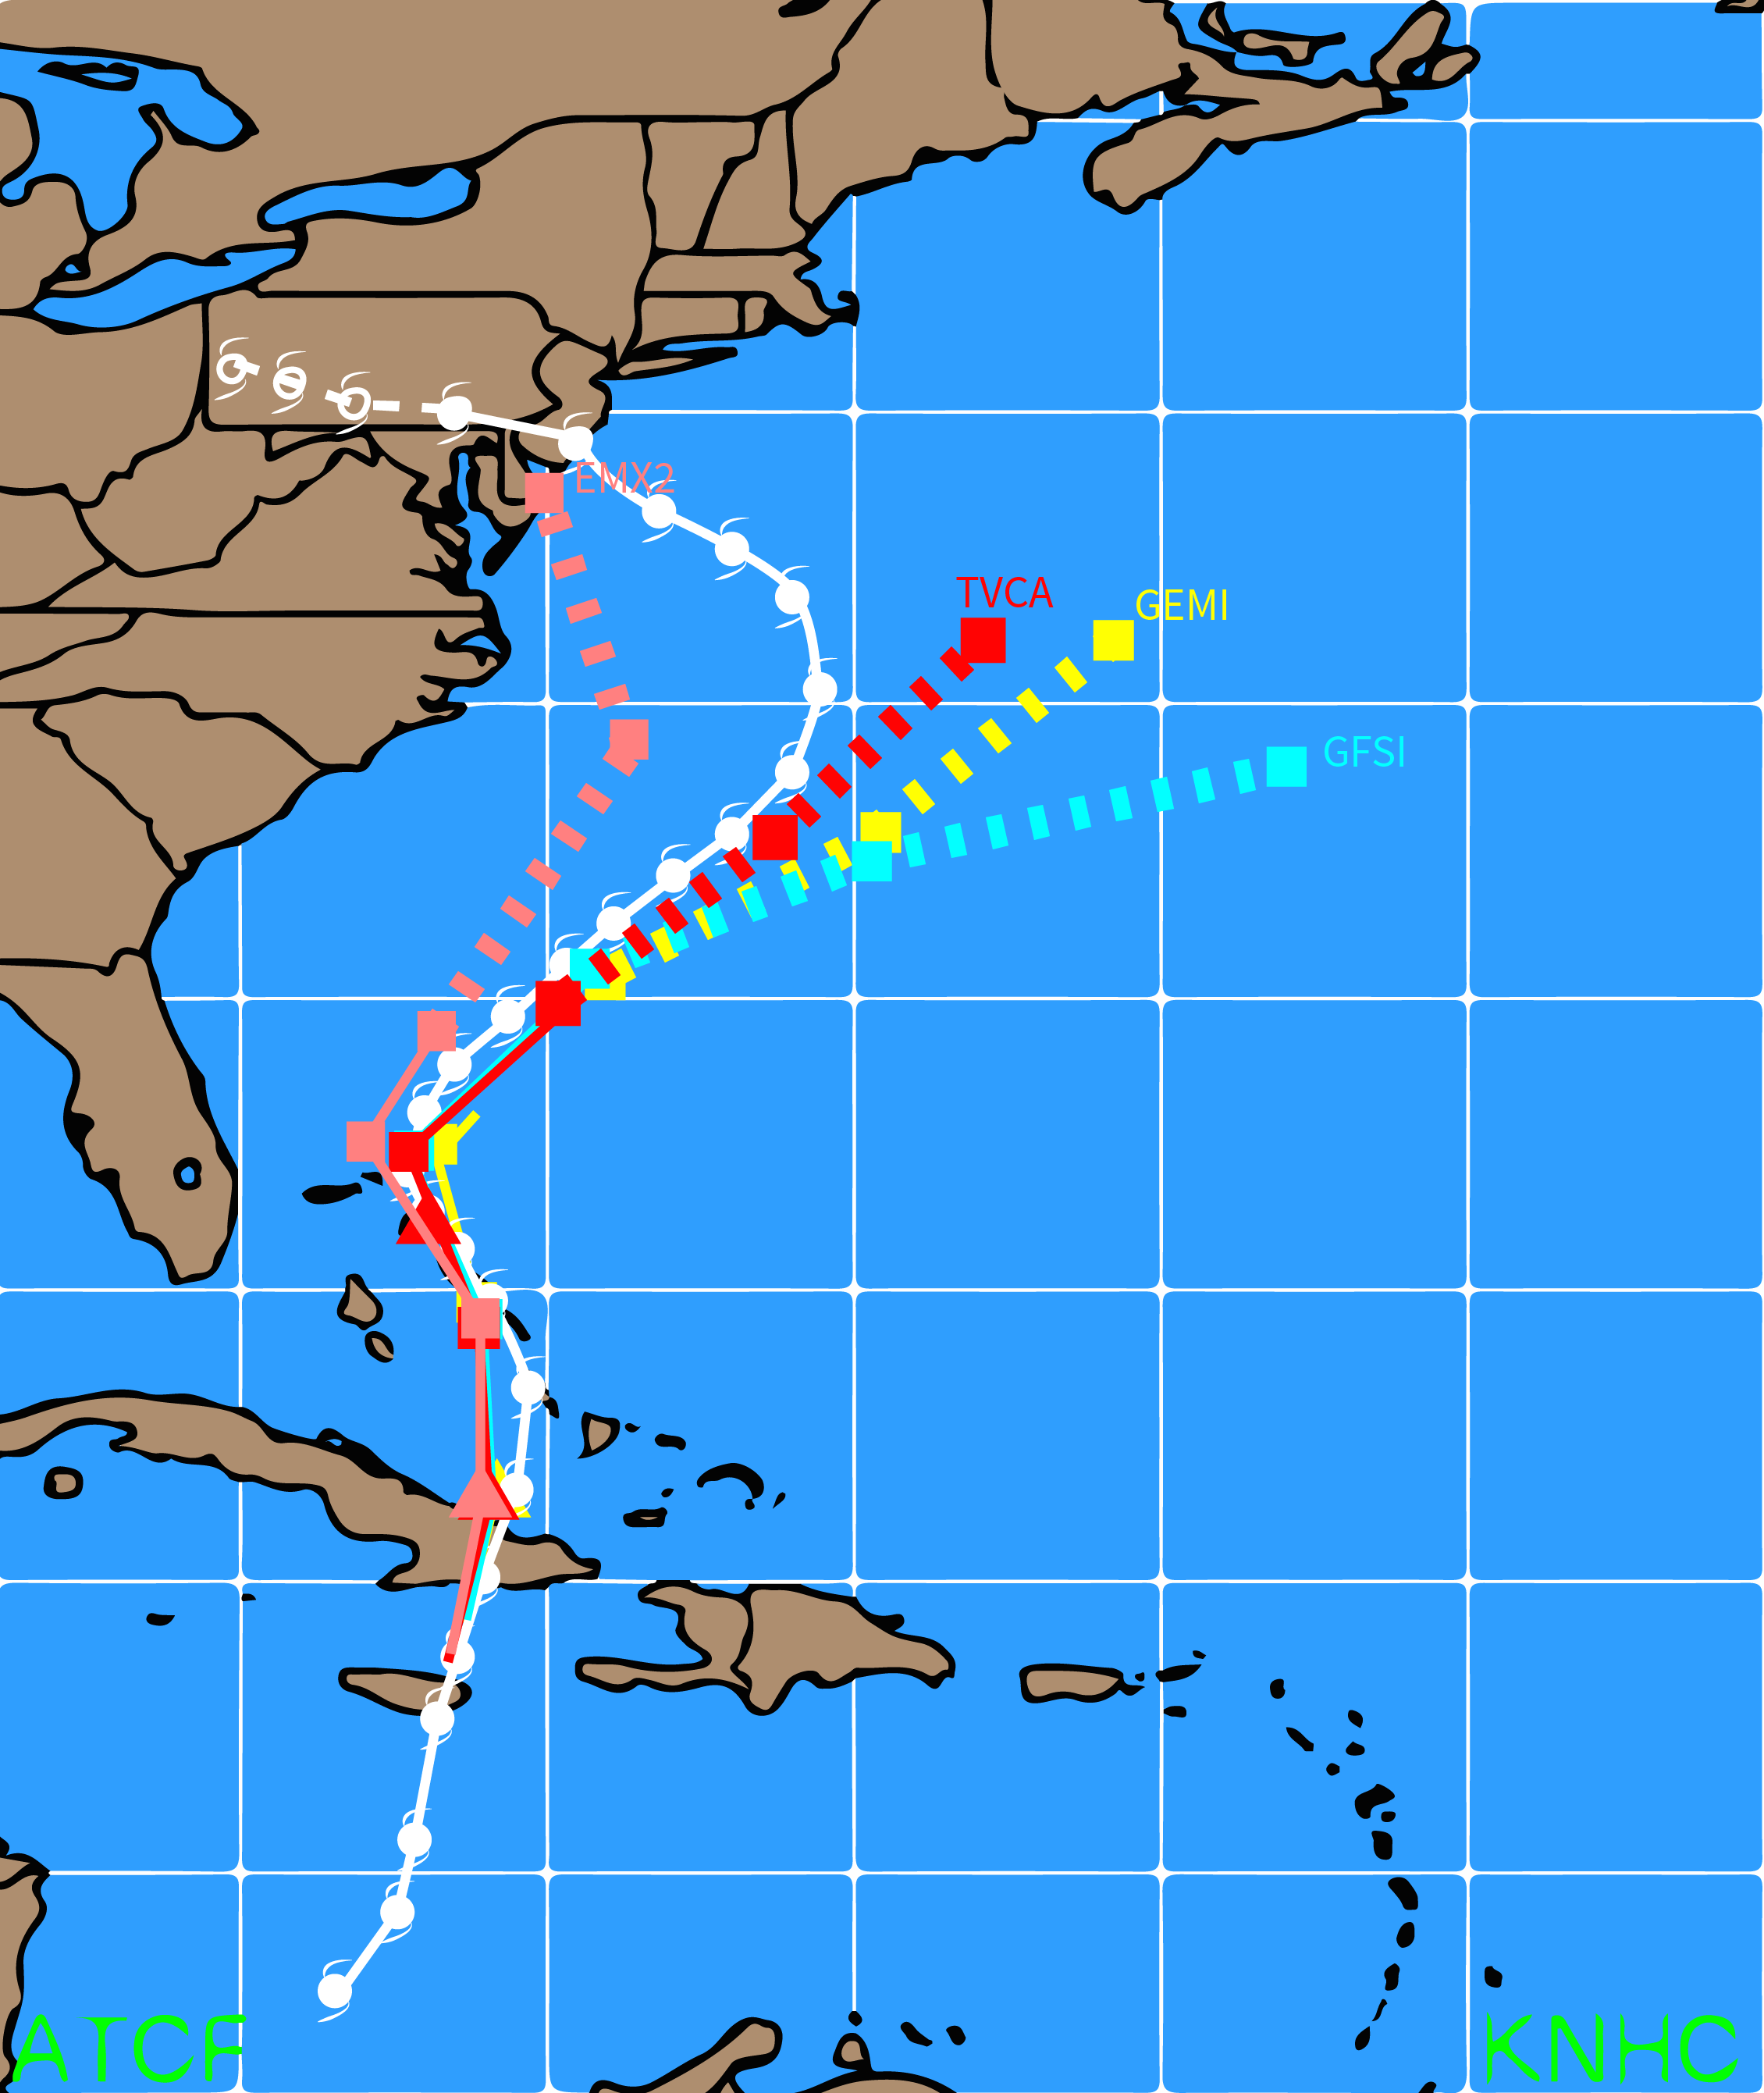
Model forecast tracks at 0000 UTC Friday 26 October 2012